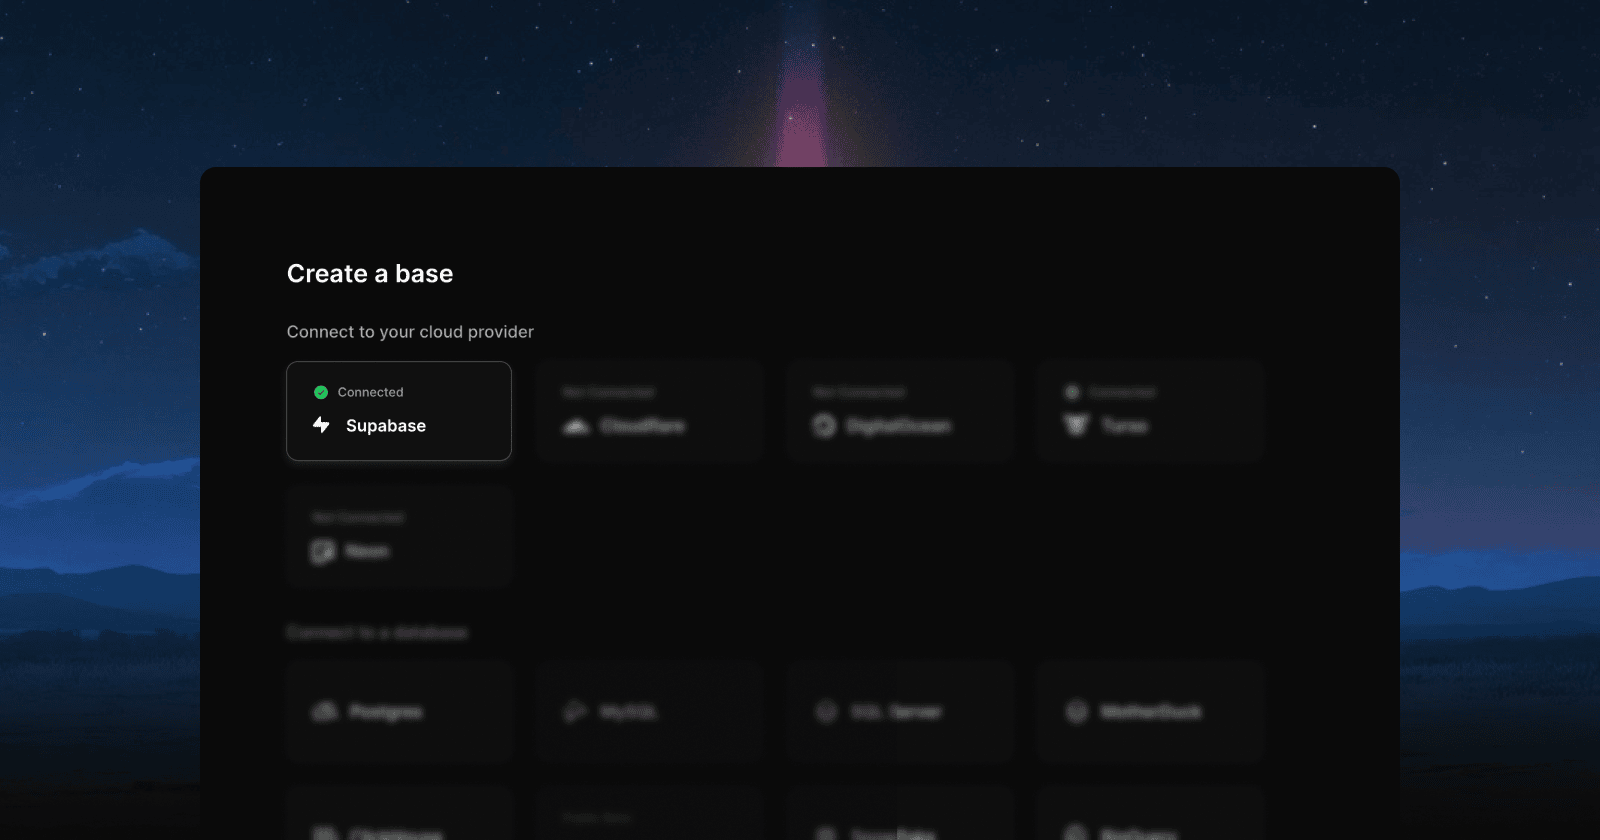
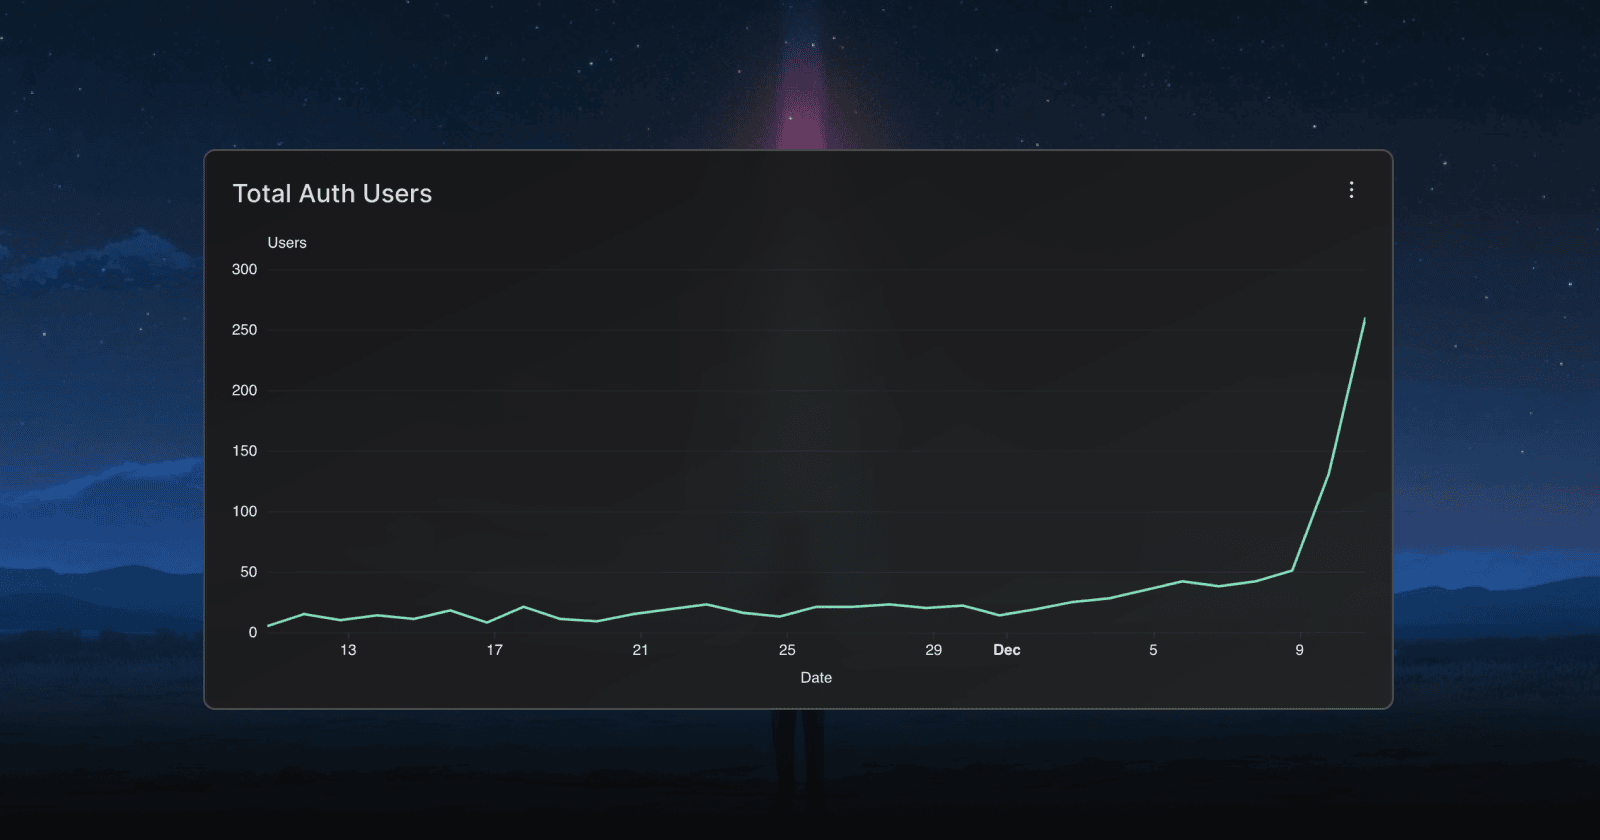
We are excited to announce a long-requested partnership: a direct integration with Supabase. Making it simpler than ever to work with one of the world’s most popular Postgres providers. Supabase already makes it easy to store and manage data, and now Outerbase adds a new layer of visualization and collaboration on top.
Why Supabase?
At first glance, you might think Outerbase is doing something Supabase already covers well, and you’re not entirely wrong. Supabase has its own query editor, table views, and even a SQL AI assistant. These are great tools. We’re not here to replace them. Instead, we focus on providing a different benefit through our Supabase integration. Outerbase turns your raw postgres data into visual, shareable dashboards. We make it possible to see what your data is saying at a glance and to invite others to do the same without extra hassle.

One-Click Connection
Connecting to your Supabase account from Outerbase now takes only a single click. Just go to “Add New Base,” select Supabase, and sign in. That’s really it, you’re connected. After that, you’ll see your projects and can pick which one you want to connect. For security purposes, you’ll still need to provide your database password, but once you’ve entered that, you’re all set!
Data Visualization Made Easier
Traditionally, if you wanted rich visualizations, you might resort to a programming language like Python. Then use a library like Pandas, Plotly or something else—and write code to produce the charts you need. With Outerbase you can do it instantly directly on top of your database, without any additional coding required. Instead of juggling separate tools or scripts, you can create beautiful visualizations inside Outerbase, simply by writing SQL or letting AI write the SQL for you.
We’ve recently launched our new charts and dashboard experiences, making this integration even more timely. Boards let you arrange charts, graphs, and other views together. They help you find connections across different metrics, track changes over time, or highlight key performance indicators for your team. Because we’ve integrated Supabase so closely, it’s now easier than ever to see your postgres data in a visual form and share it with colleagues who might not be as comfortable with SQL or code.

Collaborate Across Multiple Databases
Even if Supabase is your main data store, it’s often times not the only one. Many teams store data in multiple places—ClickHouse, DuckDB, SQLite, etc... Outerbase brings all these sources together under one roof. Providing a familiar intuitive experience on top of all of them. Now you can visualize and compare data across different databases without switching tools or passing around CSV files. Just connect what you need, build your Boards, and share them. Everyone gets the same view, without any extra setup.
Try It Out
If you already have a Supabase project, take a moment to connect it to Outerbase. You’ll see your data in a new light. Instead of reading through tables row by row, you’ll have charts that tell you what’s going on at a glance. We think this makes a real difference in how you and your team understand and act on your data. Give it a try and let us know what you think.


